what we do.
turn data into something people actually understand.
We translate raw numbers into stories worth sharing. We’re for marketers, decision-makers, and anyone who’s ever stared at a spreadsheet in despair.
Whether you need smarter reporting, story-worthy data, or a team that finally gets their own metrics, we make data simple, human, and actually (dare we say) enjoyable (there we said it).
🧂Trends analysis & insight
For teams who want to stay ahead of the curve and know what truly resonates.
🔥 ongoing Reporting & insight.
For teams who need monthly metric visibility, not monthly headaches.
⏳ Business decision analytics.
For leadership teams who want to see what’s working and what’s not.
🌶️ Data-Led Stories & Campaigns
Perfect for PR and marketing teams who need ideas that cut through.
🤝 Training & team upskilling
For teams that want to use data better, without becoming analysts


Data-Led Stories & Campaigns.
Perfect for PR and marketing teams who need ideas that cut through.
Help with ideation of data-led campaigns, sourcing creative data, data sourcing, analysis, and formatting.

Business decision analytics.
For leadership teams who want to see what’s working and what’s not.
Custom Looker Studio dashboards
Forecasting, performance, and financial models
Simplified data views for board packs and investors

Trends analysis & insight
For teams who want to stay ahead of the curve and know what truly resonates.
We analyse LLM/search demand, social trends, and audience conversations to reveal motivations, pain points, and emerging opportunities.

Training & team upskilling: Digital PR
For teams who want the confidence and know-how to create stronger, data-led campaigns.
We deliver bespoke half-day workshops, practical training on data storytelling, and online masterclasses tailored to your current campaigns.
ongoing Reporting & insight.
For teams who need monthly metric visibility, not monthly headaches.
Monthly dashboards (GA4, Looker Studio, custom data sources)
Support in automating reporting
Campaign and performance tracking
Training & team upskilling: Marketing teams
For marketing teams who want to make smarter, evidence-based decisions
Our sessions simplify analytics and sharpen creative thinking by combining bespoke workshops, data storytelling training, and hands-on guidance using your own campaigns.

The Entertainment Index
Proving how creativity competes with scale
Big brands often dominate through budget and fame. But a growing group of brands are competing differently, by using entertainment as a growth strategy, not a gimmick.
In collaboration with Small World we created The Entertainment Index to uncover who these brands are and what sets them apart. The global research report ranks brands punching above their weight by turning creativity, innovation and entertainment into real commercial advantage.
The Index is powered by a proprietary formula combining revenue performance, share of search, social buzz, media coverage and share of voice - the signals that show who’s genuinely earning attention, not buying it.
The result is a clear, data-backed view of how entertainment drives growth, and a practical framework other brands can learn from.
Explore the full report at entertainordie.com.
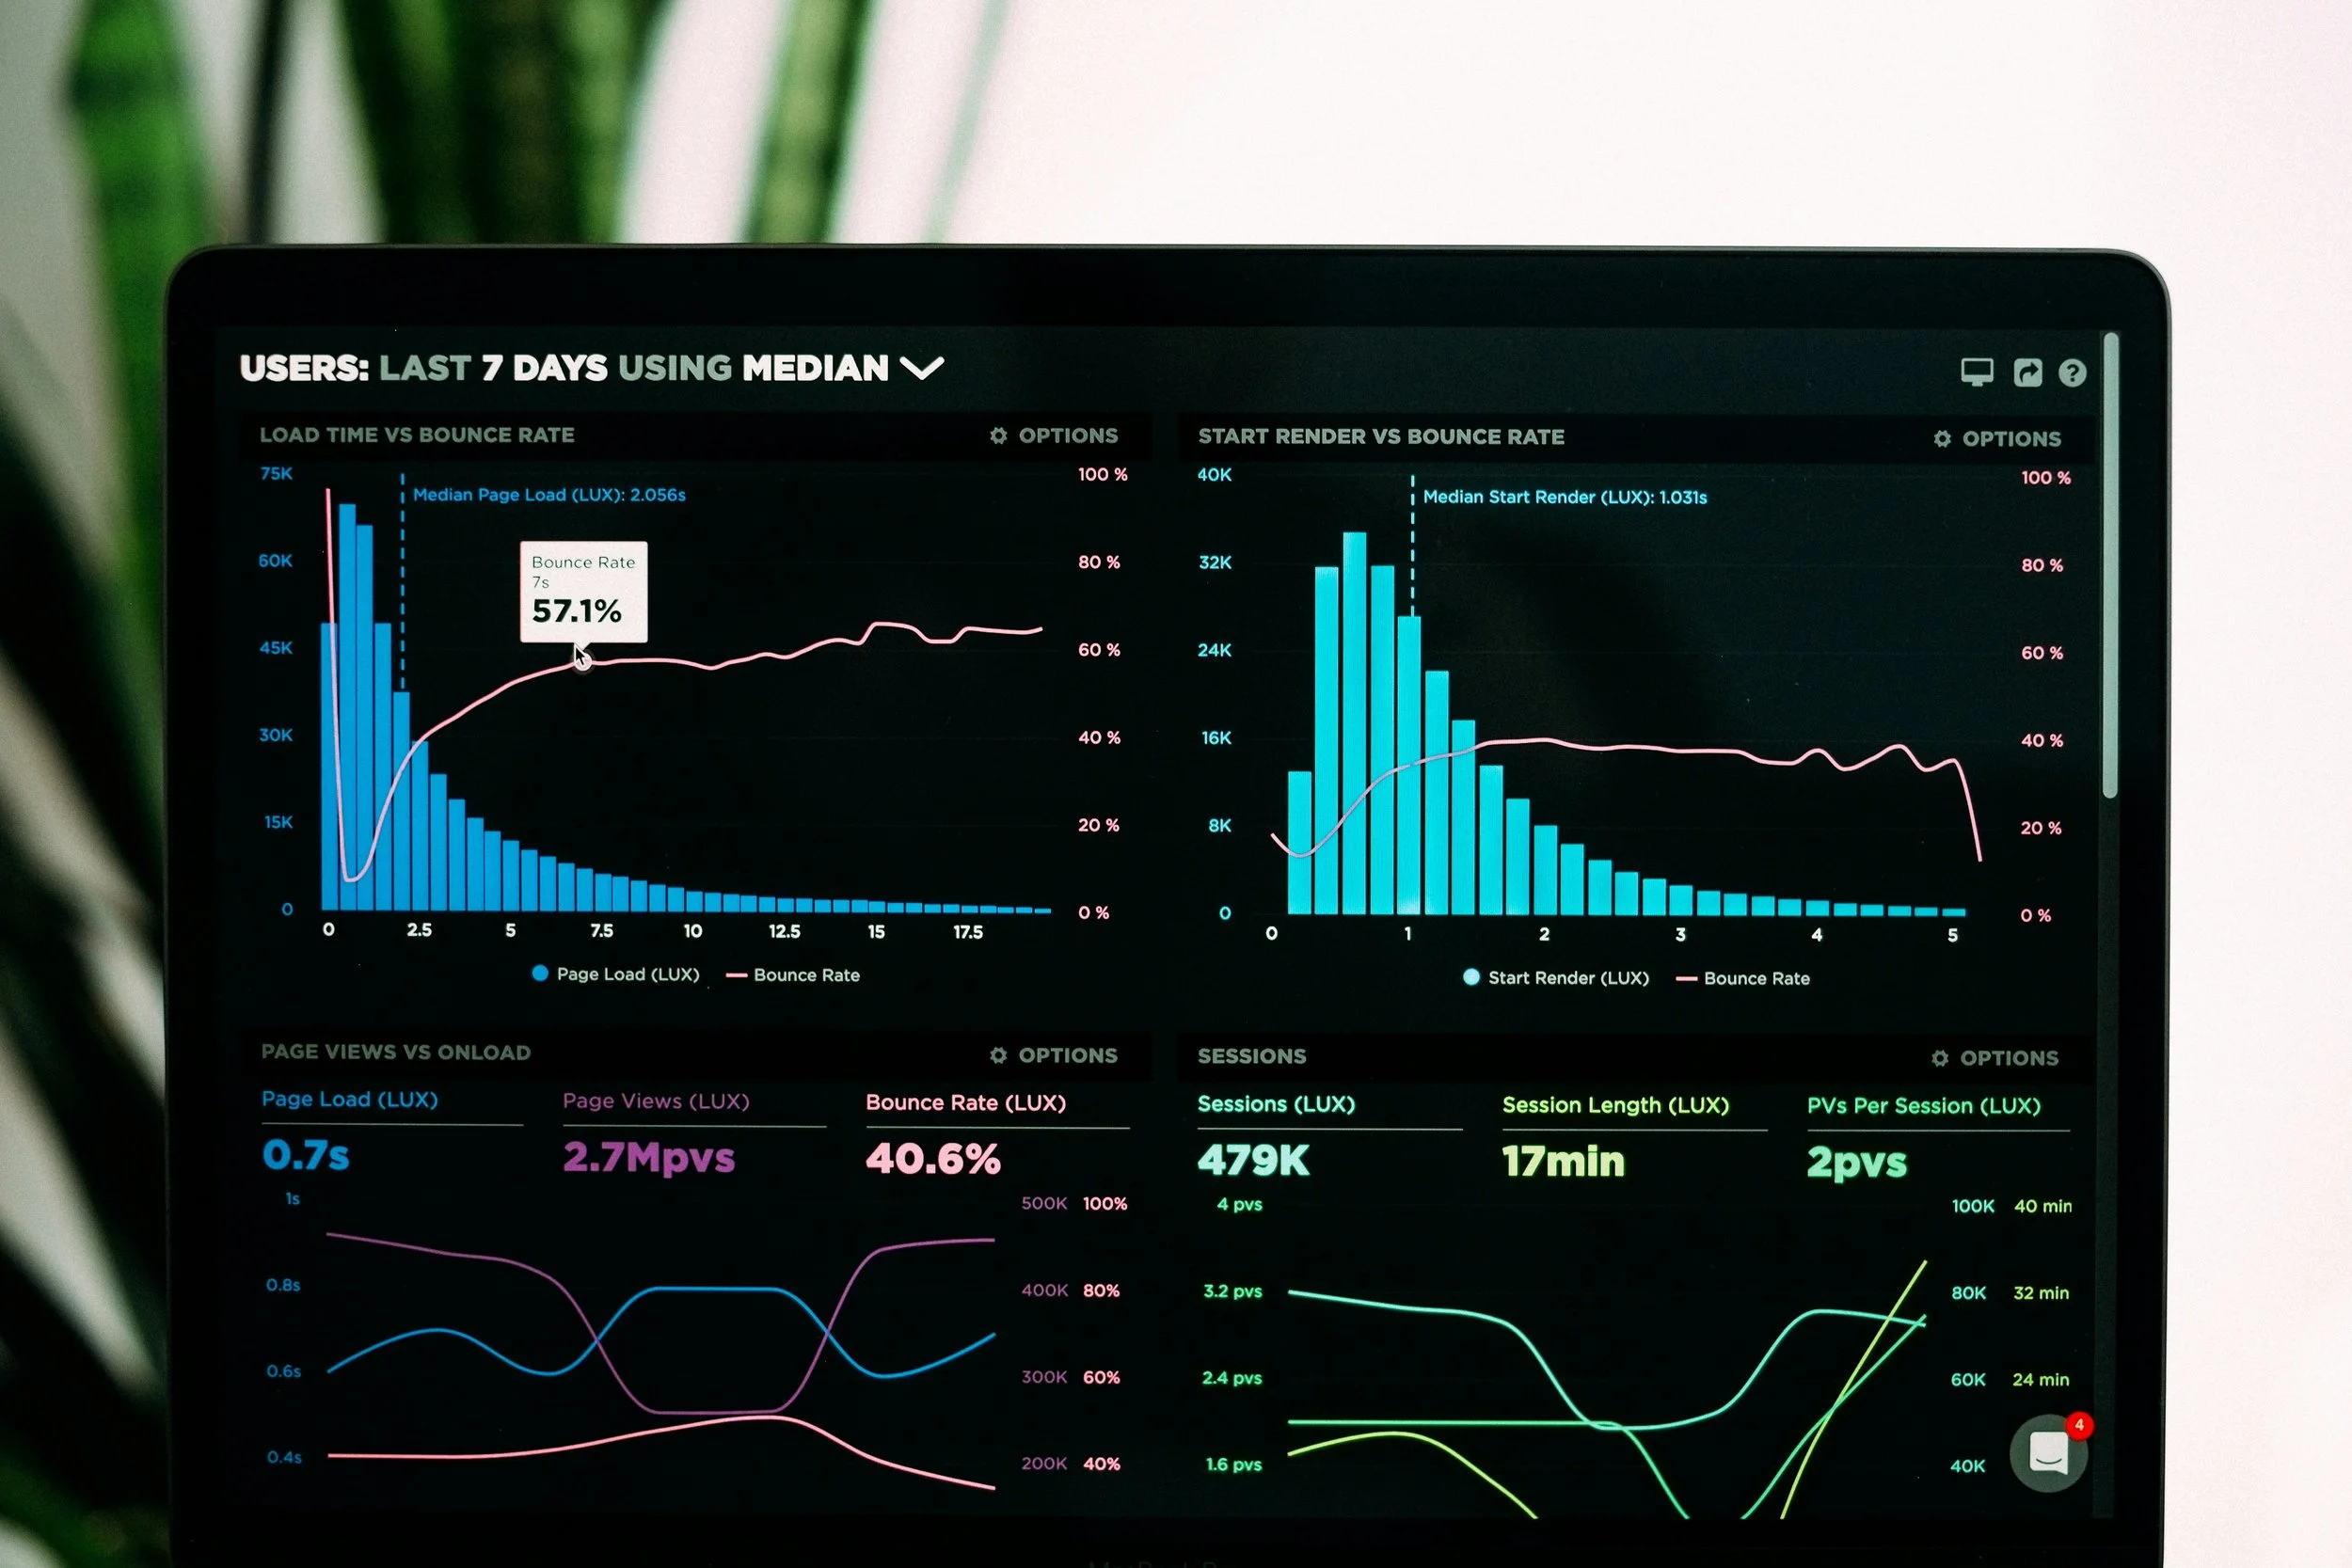
Making dashboards make sense
We deleted 70% of a client’s dashboard, not to be dramatic, to be useful.
A client’s reporting dashboard had become an IKEA manual of metrics, busy, bloated, and impossible to act actually act on.
We rebuilt it using our twist on Simon Sinek’s Golden Circle as our framework, structuring insight around three simple questions:
Why should I care? Focusing on business-critical metrics, the story of progress toward goals.
How has this come about? Showing the key drivers behind changes in performance.
What should you do about it? Providing clear, action-oriented recommendations linked to those insights.
The Outcome was a report that sparked curiosity instead of confusion.
Teams now discuss why things happen, not just what happened
*Technical experience: PowerBI, Looker Studio, Funnel, GA4, Big Query
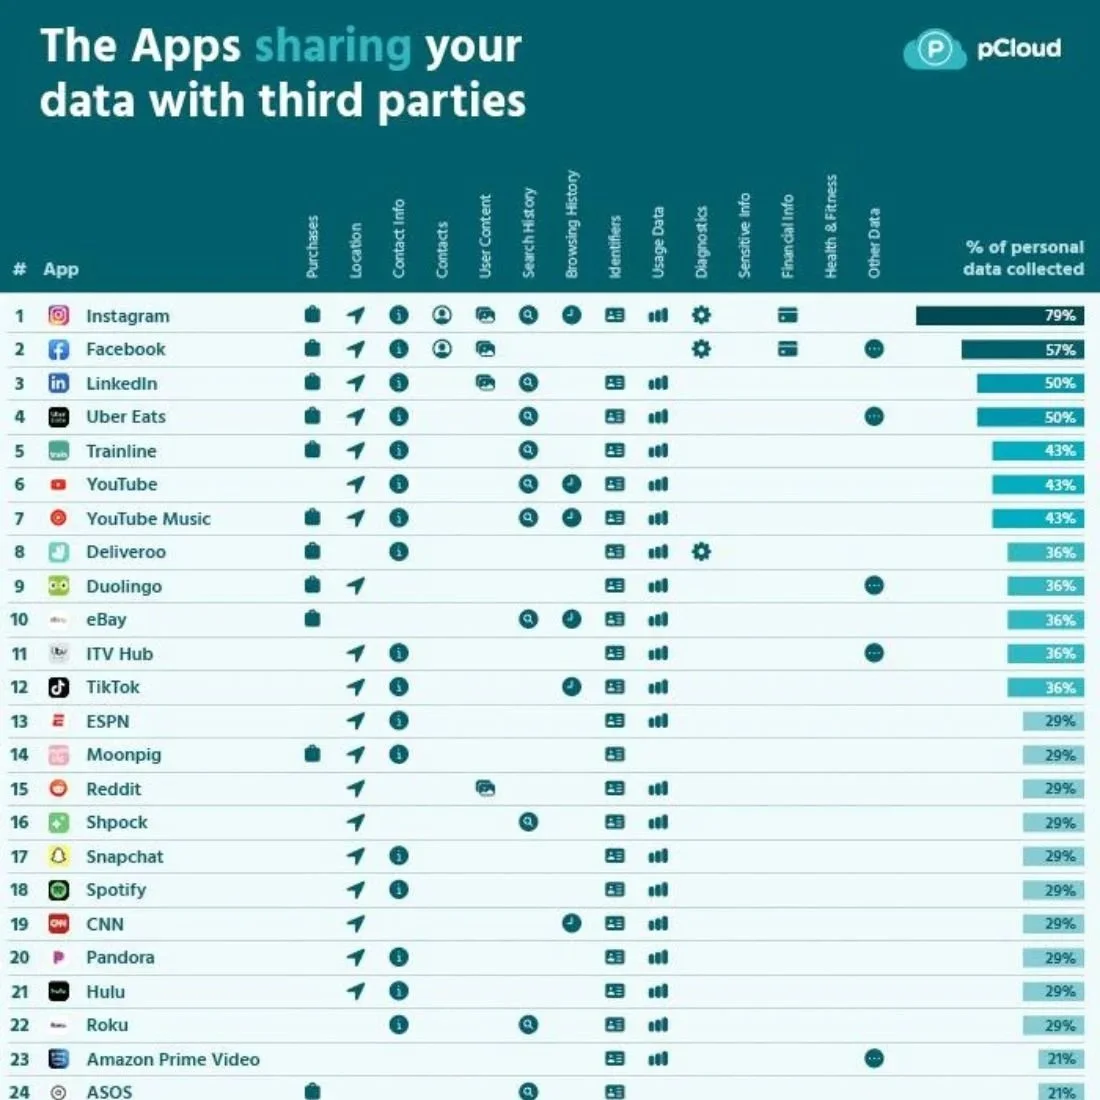
Invasive Apps
Turning privacy updates into public interest
When Apple updated its privacy policy, it quietly unlocked a new level of transparency around how apps collect and share user data. We saw an opportunity to turn that information into something people could actually understand — and care about.
Apps power almost every part of daily life, from messaging and entertainment to banking and investing. But convenience comes at a cost. Using Apple’s new App Store privacy labels, we analysed how popular apps use personal data, identifying which share the most information with third parties and which collect the most for their own benefit.
The result was Invasive Apps — a clear, data-led ranking that exposed the true privacy cost of everyday apps and transformed a technical policy update into a highly shareable, media-ready story.
Explore the project at pcloud.com/invasive-apps.